Monitoring & alerts
Sectigo Edge gives you signals from two places: the console, which shows the tenant-wide view, and each Mesh Node, which exposes local health, Prometheus metrics, the signed trust-event feed and an optional OTLP audit stream. Sectigo Edge has no built-in paging. Connect the node endpoints and event feeds to the monitoring and on-call tools you already use.
What to monitor
| Signal | Source | Alert when | Severity |
|---|---|---|---|
| Node health | GET /healthz on each node | status is not ok, or the endpoint stops answering | High |
| Node status in the console | ConsoleMesh nodes | A node is degraded, offline or disabled | High |
| Approval quorum | ConsoleIncidents, Quorum capacity | Fail closed: too few healthy nodes to approve issuance | Critical |
| Signed policy sync | edgepki_node_policy_sync_total{result="failure"} | Failures keep increasing, or policy_last_synced_at in /healthz stops advancing | High |
| Integration health | sectigo-edge integrations, or ConsoleIntegrations | Any assigned integration is degraded, or stuck in pending_node | High |
| Certificate expiry | ConsoleTrust health, Expiry exposure | Above 0, which means active certificates expire within 30 days | Medium |
| Rotation progress | edgepki_node_rotations_promoted_total | No increase during an expected renewal period | Medium |
| Issuance paused | Audit issuance.paused, or trust event incident.issuance_paused | Always | Critical |
| Resume attempts | Audit break_glass.resume_requested, break_glass.resume_expired, issuance.resumed | Always | High |
| Revocation publication | ConsoleRevocation | A CRL is expired or pending, or OCSP responses need attention | High |
| Audit integrity | ConsoleAudit evidence | Audit chain could not be verified | Critical |
| Audit witness quorum | ConsoleAudit evidence | The witness status is not healthy, so evidence export would wait | Medium |
| OTLP audit export | Node metrics | Backlog growing, failures repeating, or the cursor not advancing | High |
| Trust-event cursor | Your subscriber | HTTP 410 (cursor expired) | High |
Console indicators
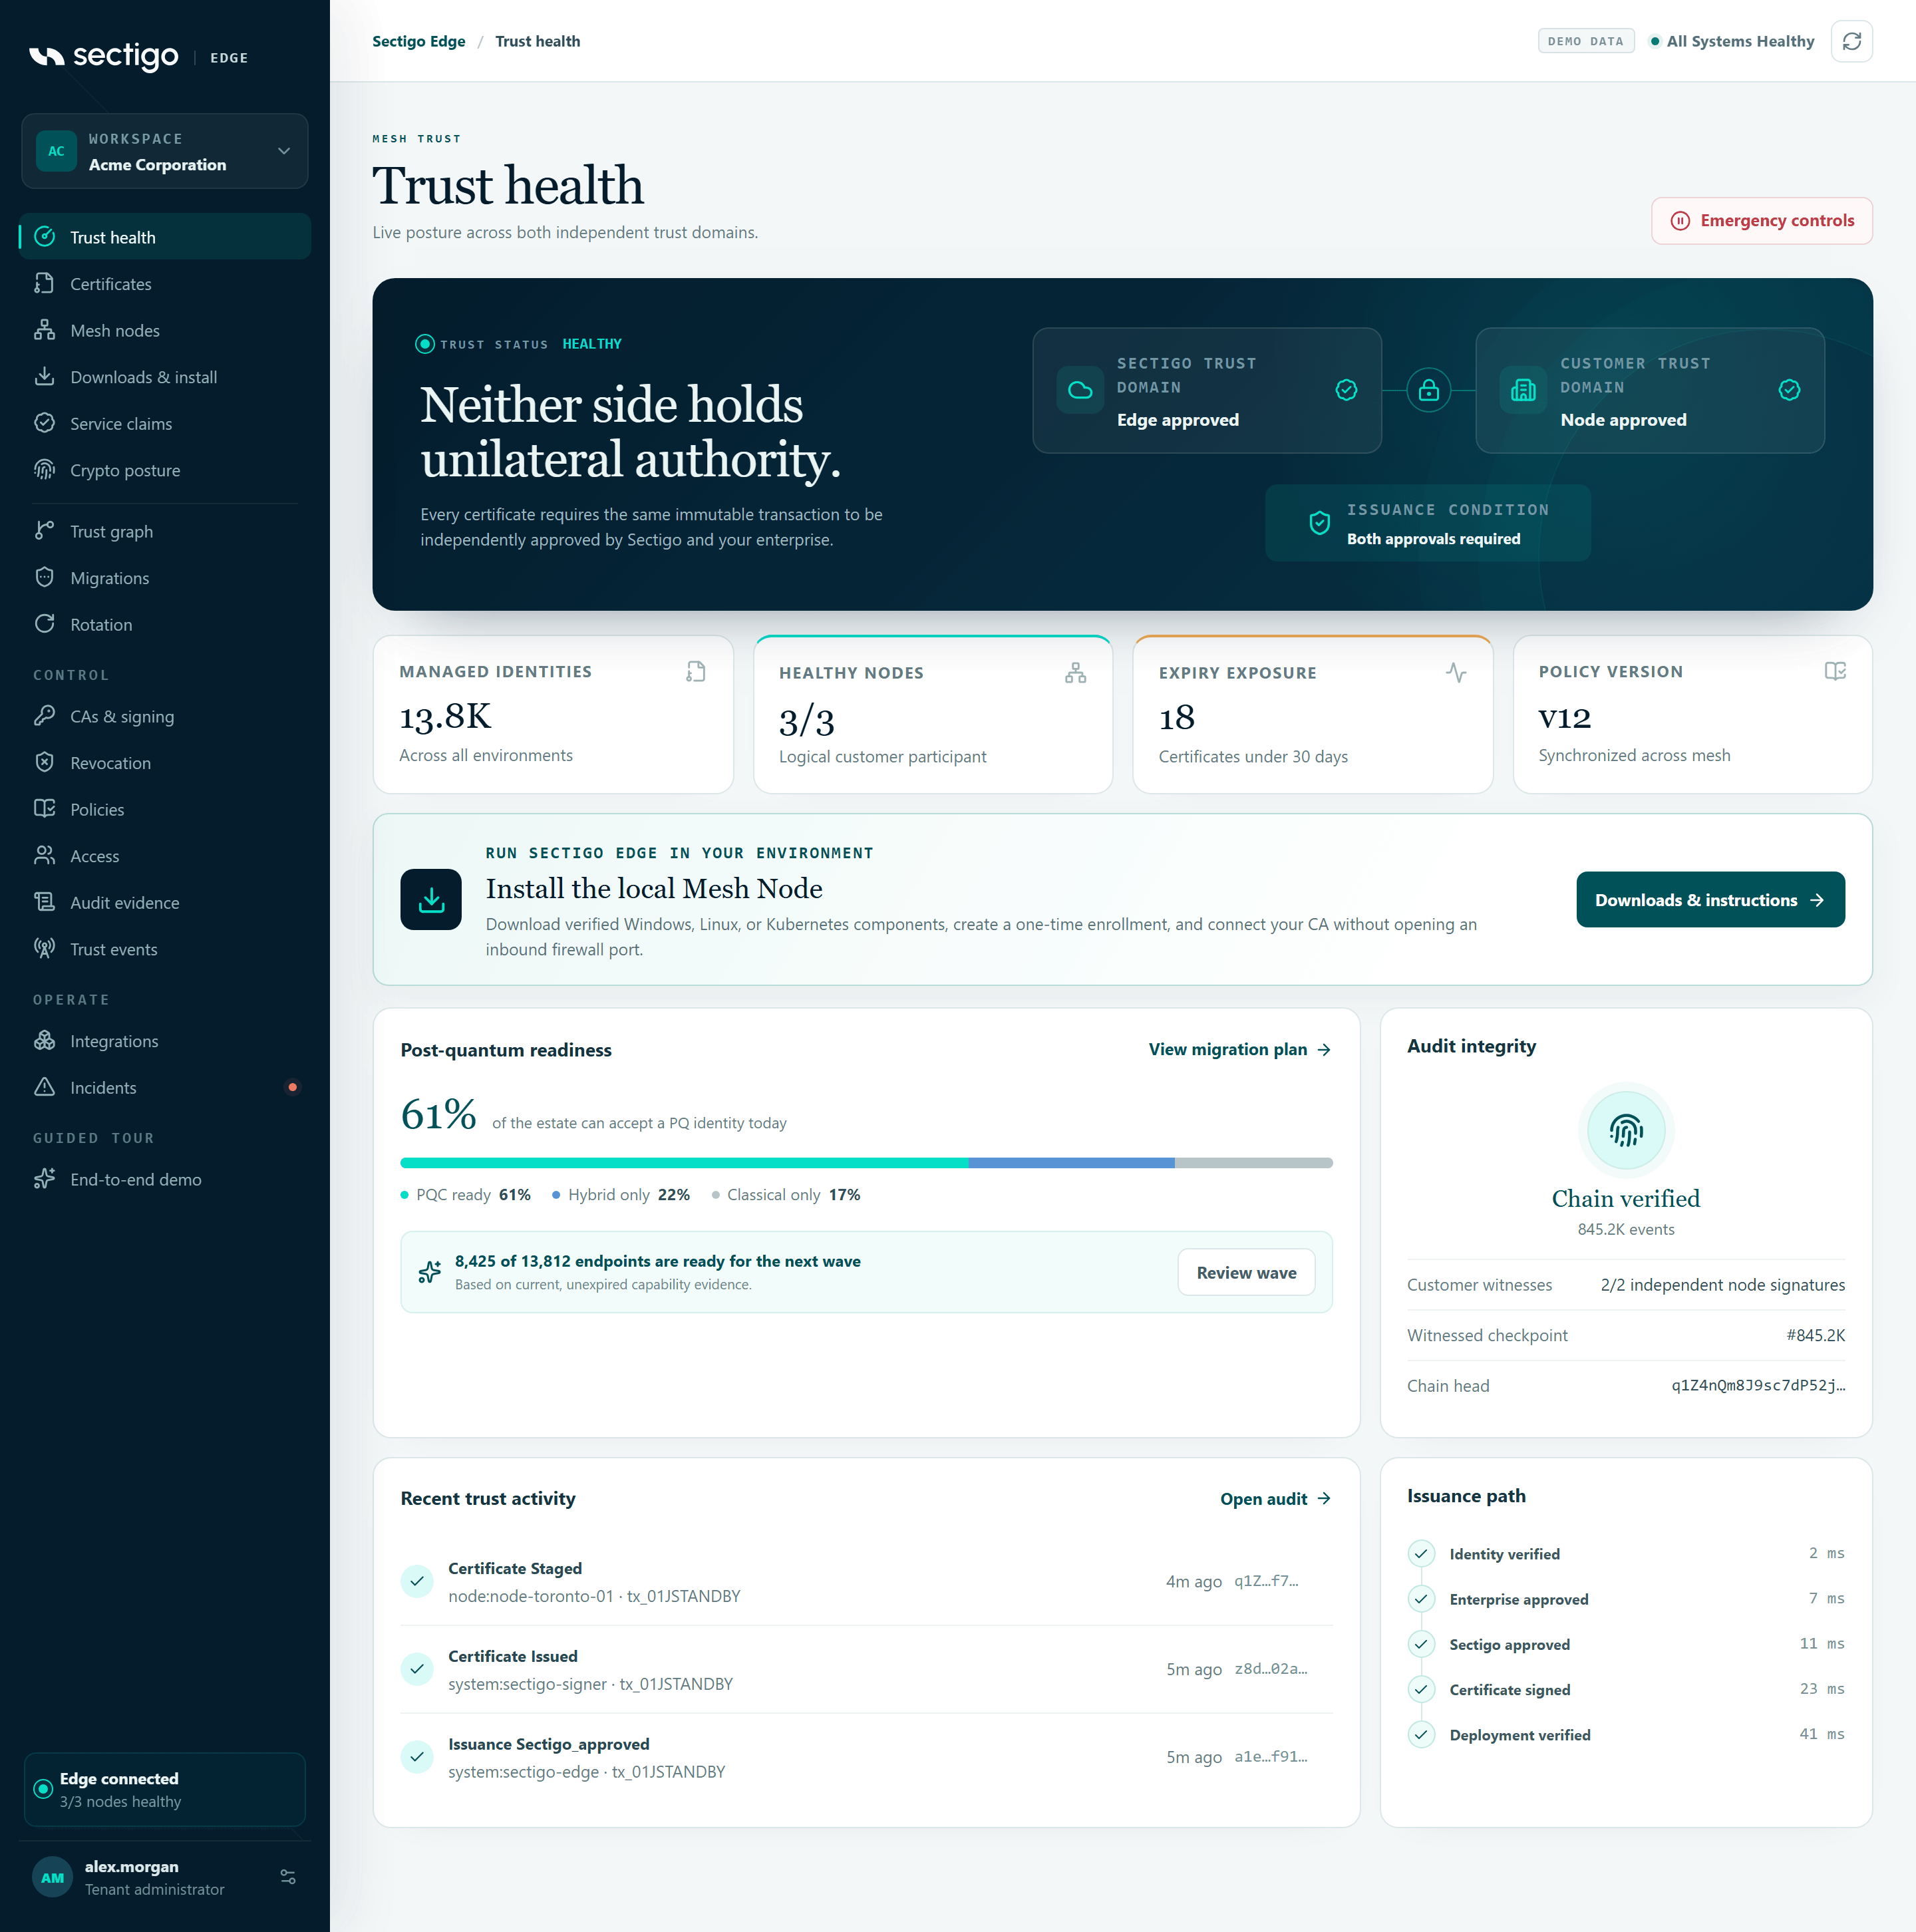
The status label in the top bar summarizes the tenant:
| Label | Meaning |
|---|---|
| trust path healthy | All nodes are healthy and trust status is healthy. |
| Degraded · n/m nodes healthy | Some enrolled nodes are not healthy. |
| Degraded | Every node is healthy, but tenant trust status is degraded. |
| No Mesh Nodes connected | No node is enrolled, so customer approval is impossible. |
| issuance paused | The kill switch is active. See Incident response. |
The Healthy nodes metric reads, for example, 3/3 with All enrolled nodes reporting healthy, or tells you how many nodes are not healthy. The ConsoleMesh nodes table shows each node's version, capabilities, last seen time and status.
Node health endpoint
Each Mesh Node answers GET /healthz on its local API. The sectigo-edge status command prints the same output:
sectigo-edge -ca /etc/sectigo-edge/ca.pem \
-cert /run/spire/svid.pem -key /run/spire/svid-key.pem status
{
"status": "degraded",
"node_id": "node_7f3c9a",
"policy_version": 12,
"policy_sha256": "pV0f3m...",
"policy_last_synced_at": "2026-10-01T14:05:02Z",
"audit_head": "Jx2cA9...",
"audit_sequence": 18342,
"integrations": [
{ "kind": "nginx", "installed": true, "health": "healthy" },
{ "kind": "otlp_audit", "enabled": true, "health": "degraded",
"error_code": "otlp_audit_transport_failed", "exporter_id": "primary-siem",
"endpoint_host": "otel-collector.example.com", "cursor": 18011,
"source_head": 18342, "backlog": 331 }
],
"dependency_discovery": { "enabled": false, "configured_probes": 0,
"successful": 0, "failed": 0, "queued": 0 }
}
status becomes degraded when the OTLP exporter is failing. It also becomes degraded when dependency discovery is enabled and either its most recent probe failed or observations are waiting to be sent. A degraded node still answers and still participates in trust decisions. Use the per-integration health and error_code fields to find the cause.
Prometheus metrics
Scrape GET /metrics on each node's local API. All metrics use the edgepki_node_ prefix.
| Metric | Type | Use it to |
|---|---|---|
edgepki_node_requests_total | counter | Track issuance requests evaluated by this node |
edgepki_node_policy_decisions_total{decision="allow"|"deny"} | counter | Spot a jump in local denials |
edgepki_node_certificates_issued_total | counter | Confirm certificates are coming back from the signer |
edgepki_node_outbox_queued_total | counter | See approved transactions queued after transport failures |
edgepki_node_rotations_promoted_total | counter | Confirm health-gated promotions are happening |
edgepki_node_policy_sync_total{result="success"|"failure"} | counter | Alert on signed policy sync failures |
edgepki_node_registration_sync_total | counter | Track service-registration sync |
edgepki_node_trust_event_batches_total, edgepki_node_trust_events_delivered_total | counter | Track trust-event feed usage |
edgepki_node_dependency_probes_total, edgepki_node_dependency_observations_total | counter | Track dependency discovery |
edgepki_node_otlp_audit_exports_total{result="success"|"failure"} | counter | OTLP export results (only when OTLP is enabled) |
edgepki_node_otlp_audit_cursor | gauge | Last sequence acknowledged by the collector |
edgepki_node_otlp_audit_source_head | gauge | Newest local audit sequence |
edgepki_node_otlp_audit_backlog | gauge | Events not yet acknowledged |
Example alert rules:
groups:
  - name: sectigo-edge-node
    rules:
      - alert: SectigoEdgePolicySyncFailing
        expr: increase(edgepki_node_policy_sync_total{result="failure"}[15m]) > 0
          and increase(edgepki_node_policy_sync_total{result="success"}[15m]) == 0
        for: 15m
        labels: { severity: page }
      - alert: SectigoEdgeOtlpBacklogGrowing
        expr: deriv(edgepki_node_otlp_audit_backlog[30m]) > 0
        for: 30m
        labels: { severity: ticket }
      - alert: SectigoEdgeOtlpCursorStalled
        expr: changes(edgepki_node_otlp_audit_cursor[30m]) == 0
          and changes(edgepki_node_otlp_audit_source_head[30m]) > 0
        labels: { severity: page }
Adjust the thresholds and windows to fit your estate.
Integration status codes
Each integration in ConsoleIntegrations has one of four states:
| State | Meaning |
|---|---|
disabled | No authority or workload path is active. |
pending_node | Desired state, or a test, is waiting for the node to acknowledge it. |
healthy | The node applied and checked the exact current revision. |
degraded | The node rejected the adapter or could not operate it. The error_code says why. |
The common error_code values are listed in Troubleshooting → Integrations.
The Sectigo SCM integration runs in the cloud and has no live connectivity check. When you save or test it, it shows degraded with scm_connectivity_not_verified, and the test message reads Test recorded, but connectivity was not verified. This is expected. Confirm SCM connectivity by issuing a test certificate.
OTLP audit export
| Watch | Why |
|---|---|
edgepki_node_otlp_audit_backlog growing | The collector is behind or unreachable. Nothing is lost, but evidence is delayed. |
edgepki_node_otlp_audit_exports_total{result="failure"} repeating | Look at the exporter's error_code in /healthz. |
| Cursor flat while the source head grows | Export has stalled. |
| Client certificate expiry | An expired client identity shows as otlp_audit_client_identity_expired. |
Exporter error codes include otlp_audit_transport_failed, otlp_audit_collector_rejected, otlp_audit_partial_success, otlp_audit_response_invalid, otlp_audit_client_identity_expired and otlp_audit_cursor_commit_failed. Setup is described in Audit & evidence export.
Trust events
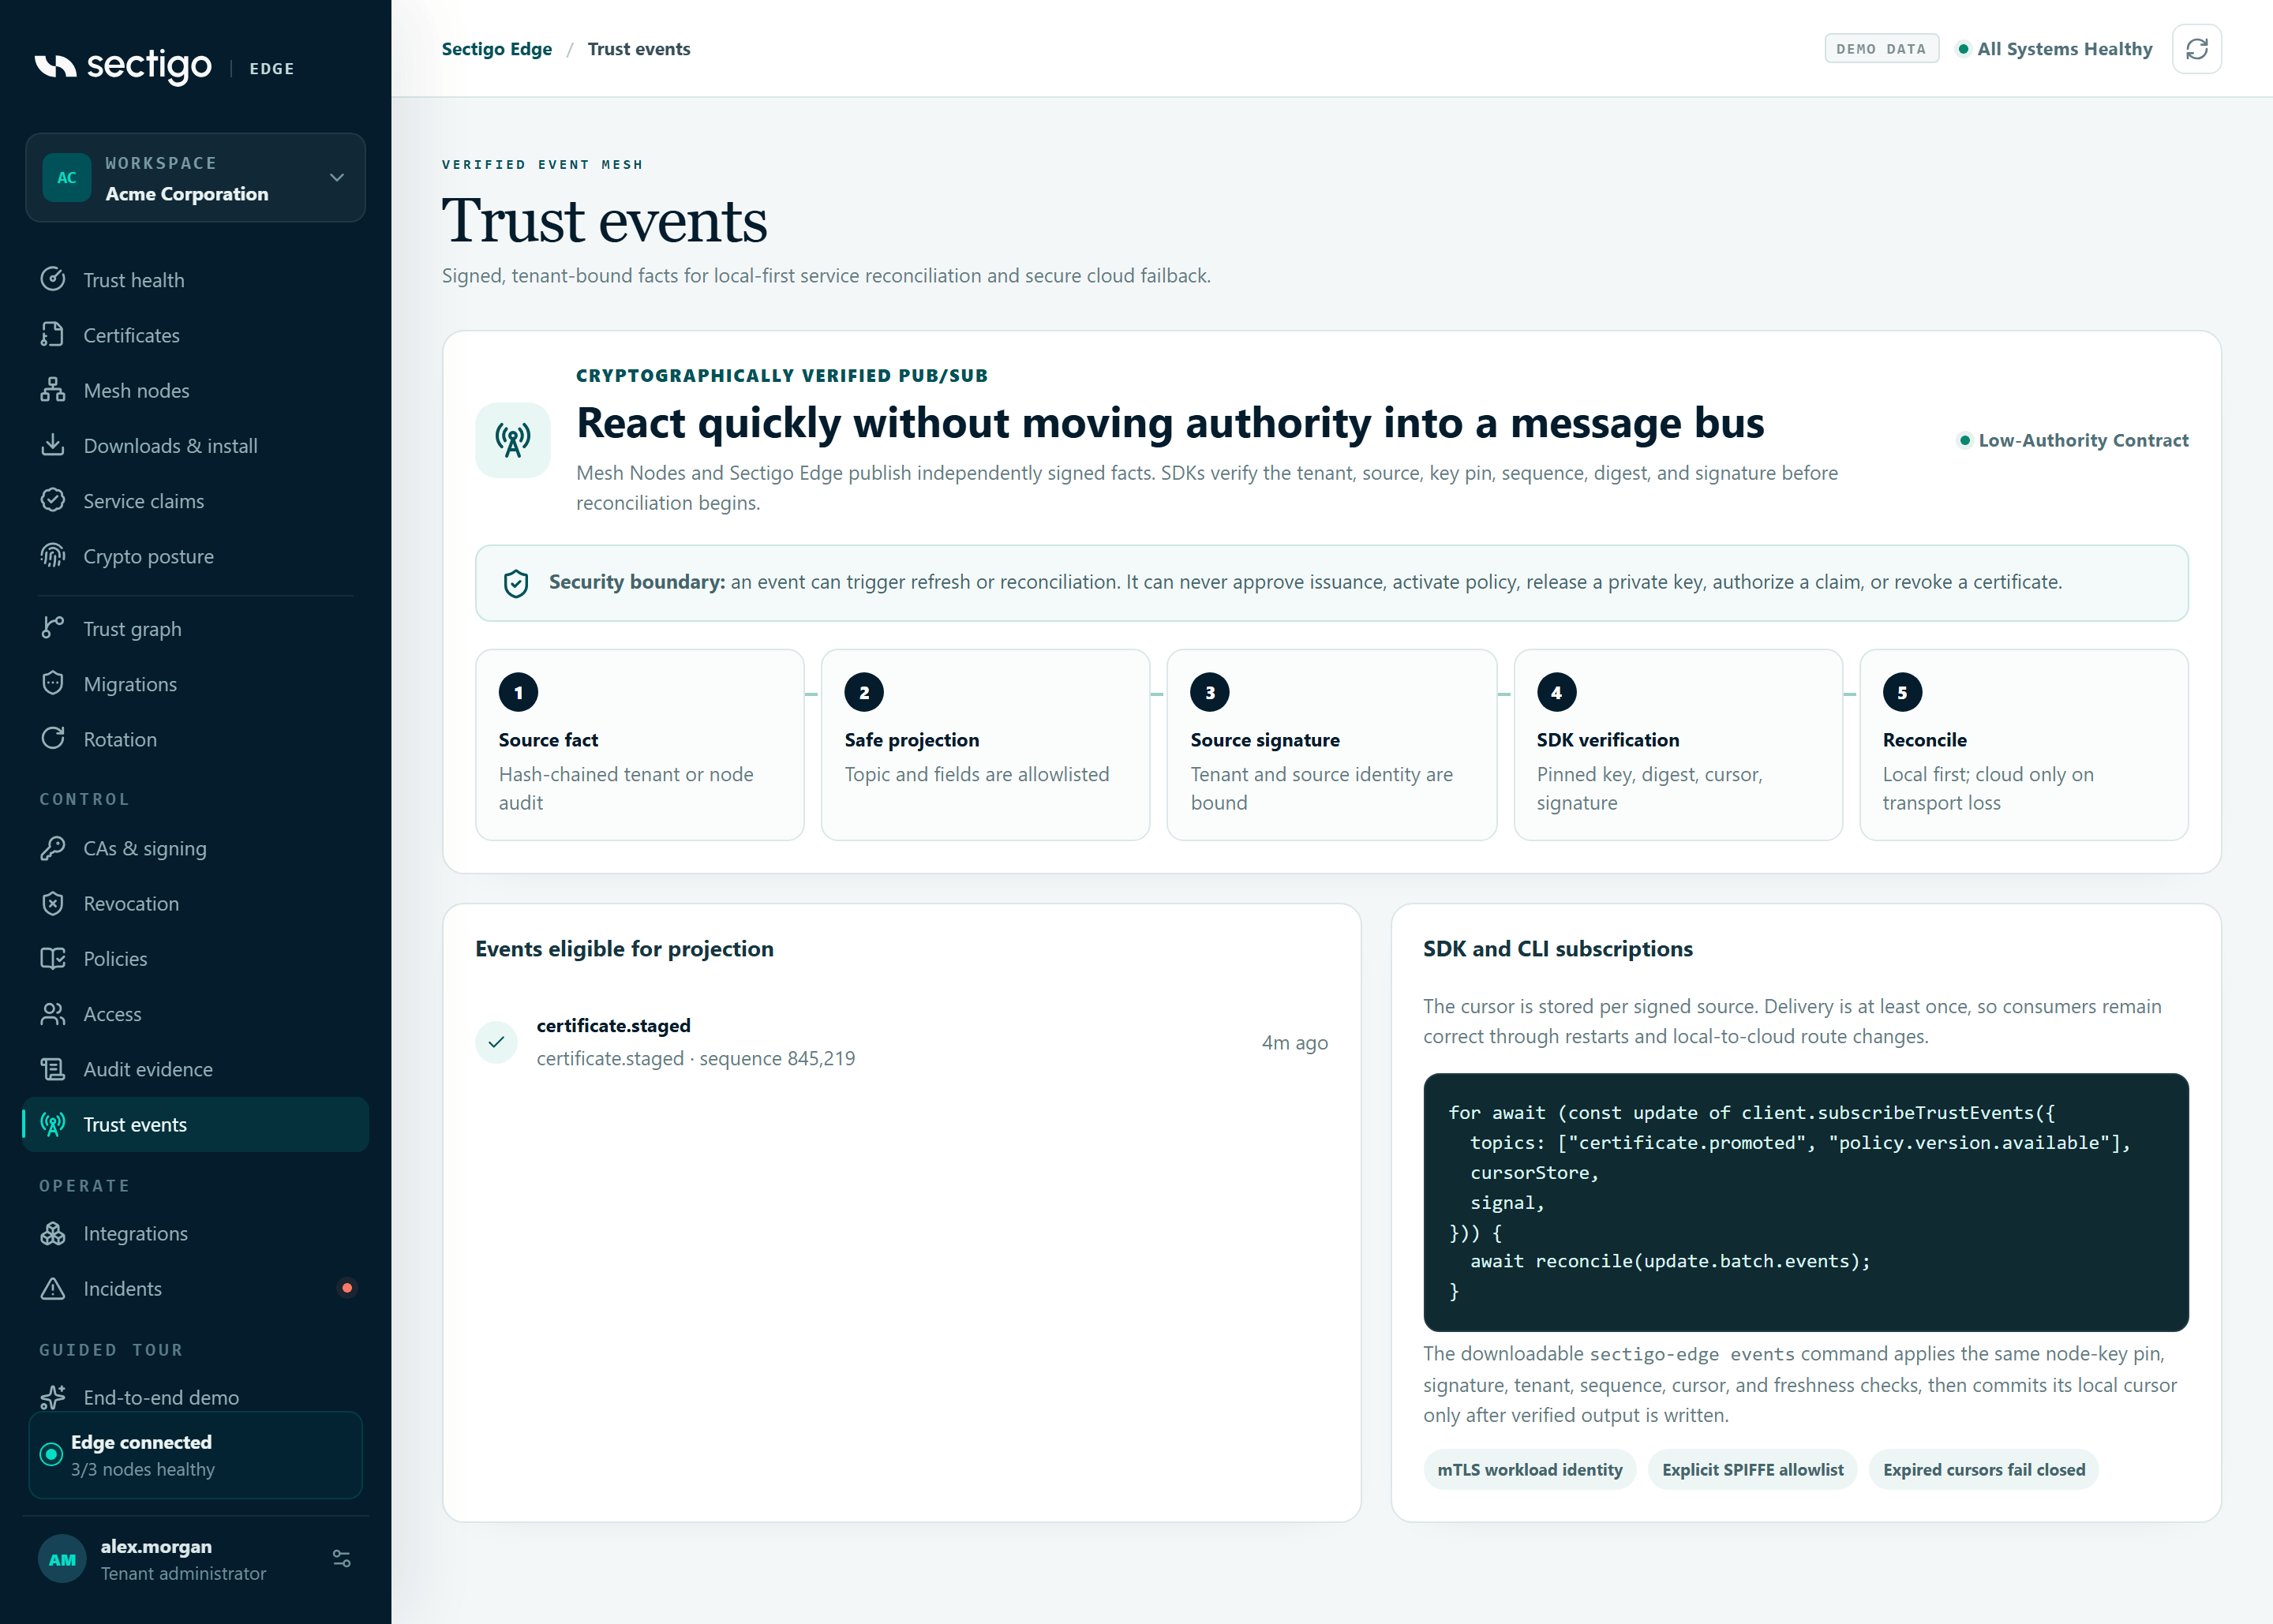
Signed trust events let your automation react quickly without polling the console. The topics are capability.observed, capability.expired, service.claimed, identity.rotated, trust_bundle.updated, policy.version.available, certificate.staged, certificate.promoted and incident.issuance_paused.
Follow them from a node with the CLI:
sectigo-edge \
-url https://127.0.0.1:9443 \
-ca /etc/sectigo-edge/ca.pem \
-cert /run/spire/svid.pem \
-key /run/spire/svid-key.pem \
-tenant acme-corp \
-node-spki /etc/sectigo-edge/node-public.pem \
-node-spki-sha256 "$SECTIGO_EDGE_NODE_SPKI_SHA256" \
-event-cursor-file /var/lib/sectigo-edge/event-cursors.json \
-event-topics certificate.promoted,incident.issuance_paused \
-event-wait 20s -watch events
Flags must come before the command. Watch mode writes one verified, signed event per line. You can pipe that output into your alerting tool.
Events are notifications, not authority. An event can trigger a refresh, but it can never approve, activate, revoke or resume anything. When a cursor expires, the command stops and the API returns HTTP 410. Alert on this and resynchronize deliberately. Never overwrite the cursor file automatically.
The local event endpoint is disabled unless you allow specific observer identities in the node configuration (trust_event_subscriber_spiffe_prefixes). See Node configuration.
Related
- Mesh nodes console reference
- Local operations UI: a read-only view of one node's health
- Troubleshooting